175M+ ethically sourced IPs built for the highest reliability.
High-speed, cost-effective proxies built for any scraping workload.
Premium static residential proxies from trusted ASNs for most difficult targets.
Dedicated IPs from premium ASNs for demanding scraping.

AI-powered proxy solution for optimized web scraping performance.

20M+ IP addresses from real mobile devices for precise targeting.

Free Chrome proxy manager extension that works with any proxy provider.

Free Android proxy manager app that works with any proxy provider.

Free community-driven tools to improve your web scraping projects.
Web Scraper API
All-in-one web data collection platform for every stage of web scraping.
Fast Search API
Ultra-fast organic search results scraper tailored for AI workflows.
Headless Browser
Advanced browser automation solution for AI agents and scraping.
AI Studio
A suite of AI-powered tools for various scraping projects.

Documentation
All features, parameters, and integration details, backed by code samples in every coding language.
Tutorials, samples, and guides.
Latest fixes and features.


What a Decade of Public Data Reveals About the Real Consumer Cost of the July 4th Cookout Basket


Oxylabs Research
Last updated on
2026-07-02
8 min read
Oxylabs turned a decade of publicly available government data into a clear picture of cookout affordability, showing that open access to online information benefits everyone.
This July 4th, Americans will mark the 250th anniversary of the Declaration of Independence. The White House has organized a year of ceremonies under the title Freedom 250, and, according to NRF, 86% of Americans plan to celebrate, including with a customary cookout.
Two-thirds of Americans say summer grilling season is their favorite time of year, and the typical American plans to attend five cookouts and host four this summer. For most of them, that means a grill, a cooler, and a trip to the grocery store.
You might assume that the current economic situation would make that trip less pleasant than in previous years. Gas prices currently are above $4.17 a gallon nationally, more than a dollar higher than a year ago. Wall Street strategists have warned that if oil prices remain high, the economy could start to feel the pressure by the 4th of July itself, as summer driving costs chip away at household budgets.
A Gallup poll conducted in April 2026 found that a record 55% of Americans say their financial situation is getting worse. This is the fifth consecutive year a majority of Americans have said their finances are deteriorating rather than improving, a streak last seen during the Great Recession.
Ahead of Memorial Day, headlines warned of double-digit price spikes on cookout staples compared to a year earlier. But a single year’s sticker prices don’t tell you much about real purchasing power – and that’s exactly what most coverage misses.
So what has actually happened to the cost of the cookout? Not just since last year, but over the past decade?
Oxylabs used publicly available data from the Federal Reserve Economic Data (FRED) database to track the inflation-adjusted prices of every major ingredient in a classic 4th of July spread – burgers, hot dogs, and a soft drink – every month from January 2016 through April 2026.
The numbers tell a decade-long story that suggests neither the economic doomsayers nor the optimists have it quite right.
Key Takeaways
Beef is up 32%, cheese and tomatoes are down – 17% and 18% respectively. The result: your burger costs 11% more than in 2016.
The hot dog is the same in real terms as it was in 2016 – 0% change.
Soft drinks prices have risen 30% in real terms since 2016, with costs peaking in early 2024.
At 0.6% of a median weekly paycheck, a single-person BBQ basket costs the same as a decade ago, though this is one of the most expensive years of the period.
The late-2010s affordability cushion is gone. Affordability improved from 2016–2020, then reversed. 2026 is now the second-worst affordability year of the decade.
How the Cookout Price Has Changed Over the Decade
When Americans bring up food prices, they are usually talking about what they see on the checkout screen. But that number does not reveal much by itself. It is influenced by general inflation, which has climbed around 40% this decade.
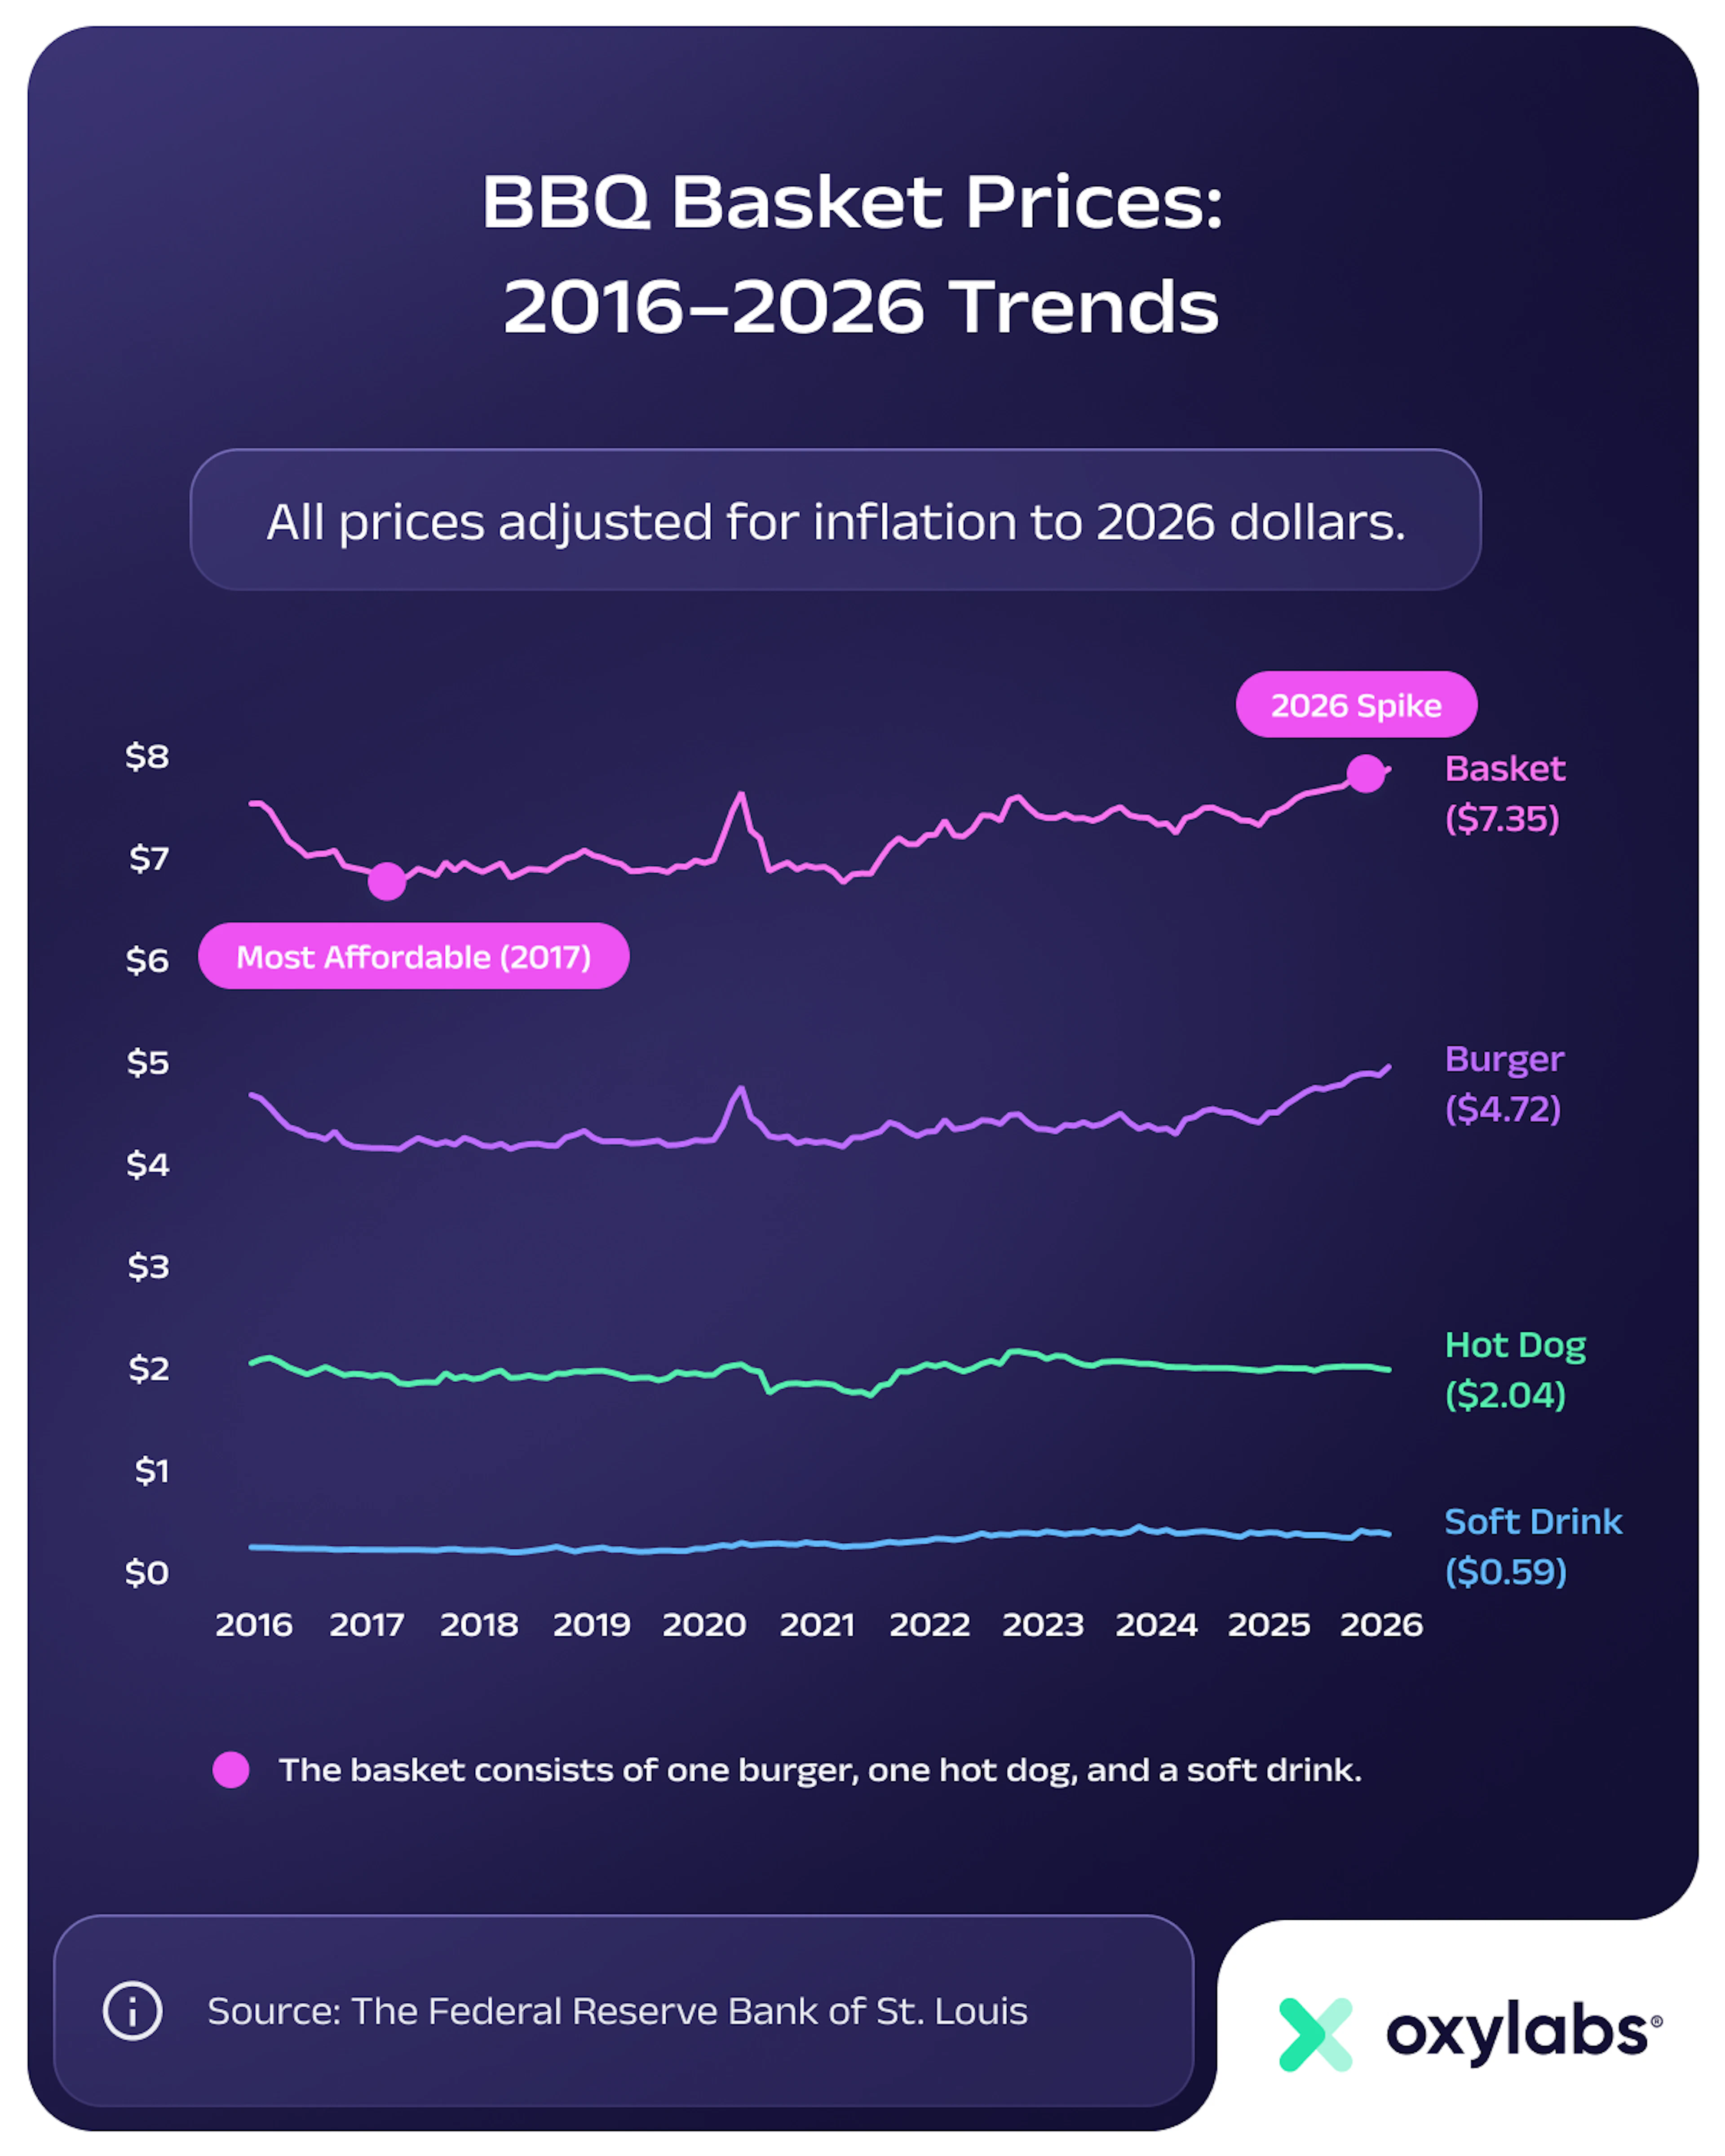
Oxylabs adjusted all prices to 2026 dollars using the Consumer Price Index, creating an apples-to-apples comparison across ten years. On that basis, a single-person cookout serving – one burger, one hot dog, and one soft drink (67.6 fl oz) – cost the equivalent of about $7.05 in January 2016. In April 2026, it cost $7.35, meaning that in real terms, very little has changed.
Measured as a share of a weekly paycheck, the picture is similarly stable. In 2016, a cookout serving accounted for 0.6% of median weekly earnings. In 2026, it takes the same share – 0.6%. A cookout for a typical US household of four people takes up about 2.4% of one week’s pay. That is under an hour of work at the median wage. By that measure, the cookout remains well within reach for an average American.
Consumers focus on the sticker shock of a single ingredient, but the public data tells a more accurate story. The cookout is an economic portfolio. When you track the entire basket over a decade, you realize that diversification is the consumer’s best defense against inflation.
Marija Gecaitė, Chief Commercial Officer (CCO) at Oxylabs
How prices evolved over the decade, however, is a different story. From 2016 through 2020, affordability improved every single year. The share of a paycheck accounted for by one cookout serving fell from 0.6% to 0.5%, and the number of cookout servings a typical weekly paycheck could theoretically buy rose from 169 to 187. That improvement reflected a genuine period of flat or declining real food prices against slowly rising real wages.
Then came 2022. The food inflation wave of that year delivered the largest single-year jump in cookout costs of the entire decade. In a single year, most of the gains of the previous five were erased. Since then, recovery has been partial and fragile, and in 2026, the burger basket hit near its decade-high, dragged up by beef prices that have not even peaked yet.
Blame the Beef – Mostly
The burger is the centerpiece of any July 4th cookout, and its price story is almost entirely a question of beef.
Ground beef has risen 32% year-over-year in real terms since 2016, the largest real-price increase of any item tracked in the dataset.
In January 2016, a pound of ground beef cost the equivalent of $5.56 in today’s dollars. By April 2026, that had risen to $6.90. And crucially, the April 2026 figure is the highest in the entire ten-year dataset, with prices still rising.
The cause, however, is biological, not commercial. U.S. cattle herds have contracted significantly following multi-year droughts across the southern Plains states. This forced ranchers to liquidate livestock rather than feed them through dry conditions.
Rebuilding a cattle herd takes years as cows do not reproduce quickly. As a result, the industry is still working through the recovery cycle. Until the herd rebuilds to pre-drought levels, supply will remain tight and prices will stay elevated.
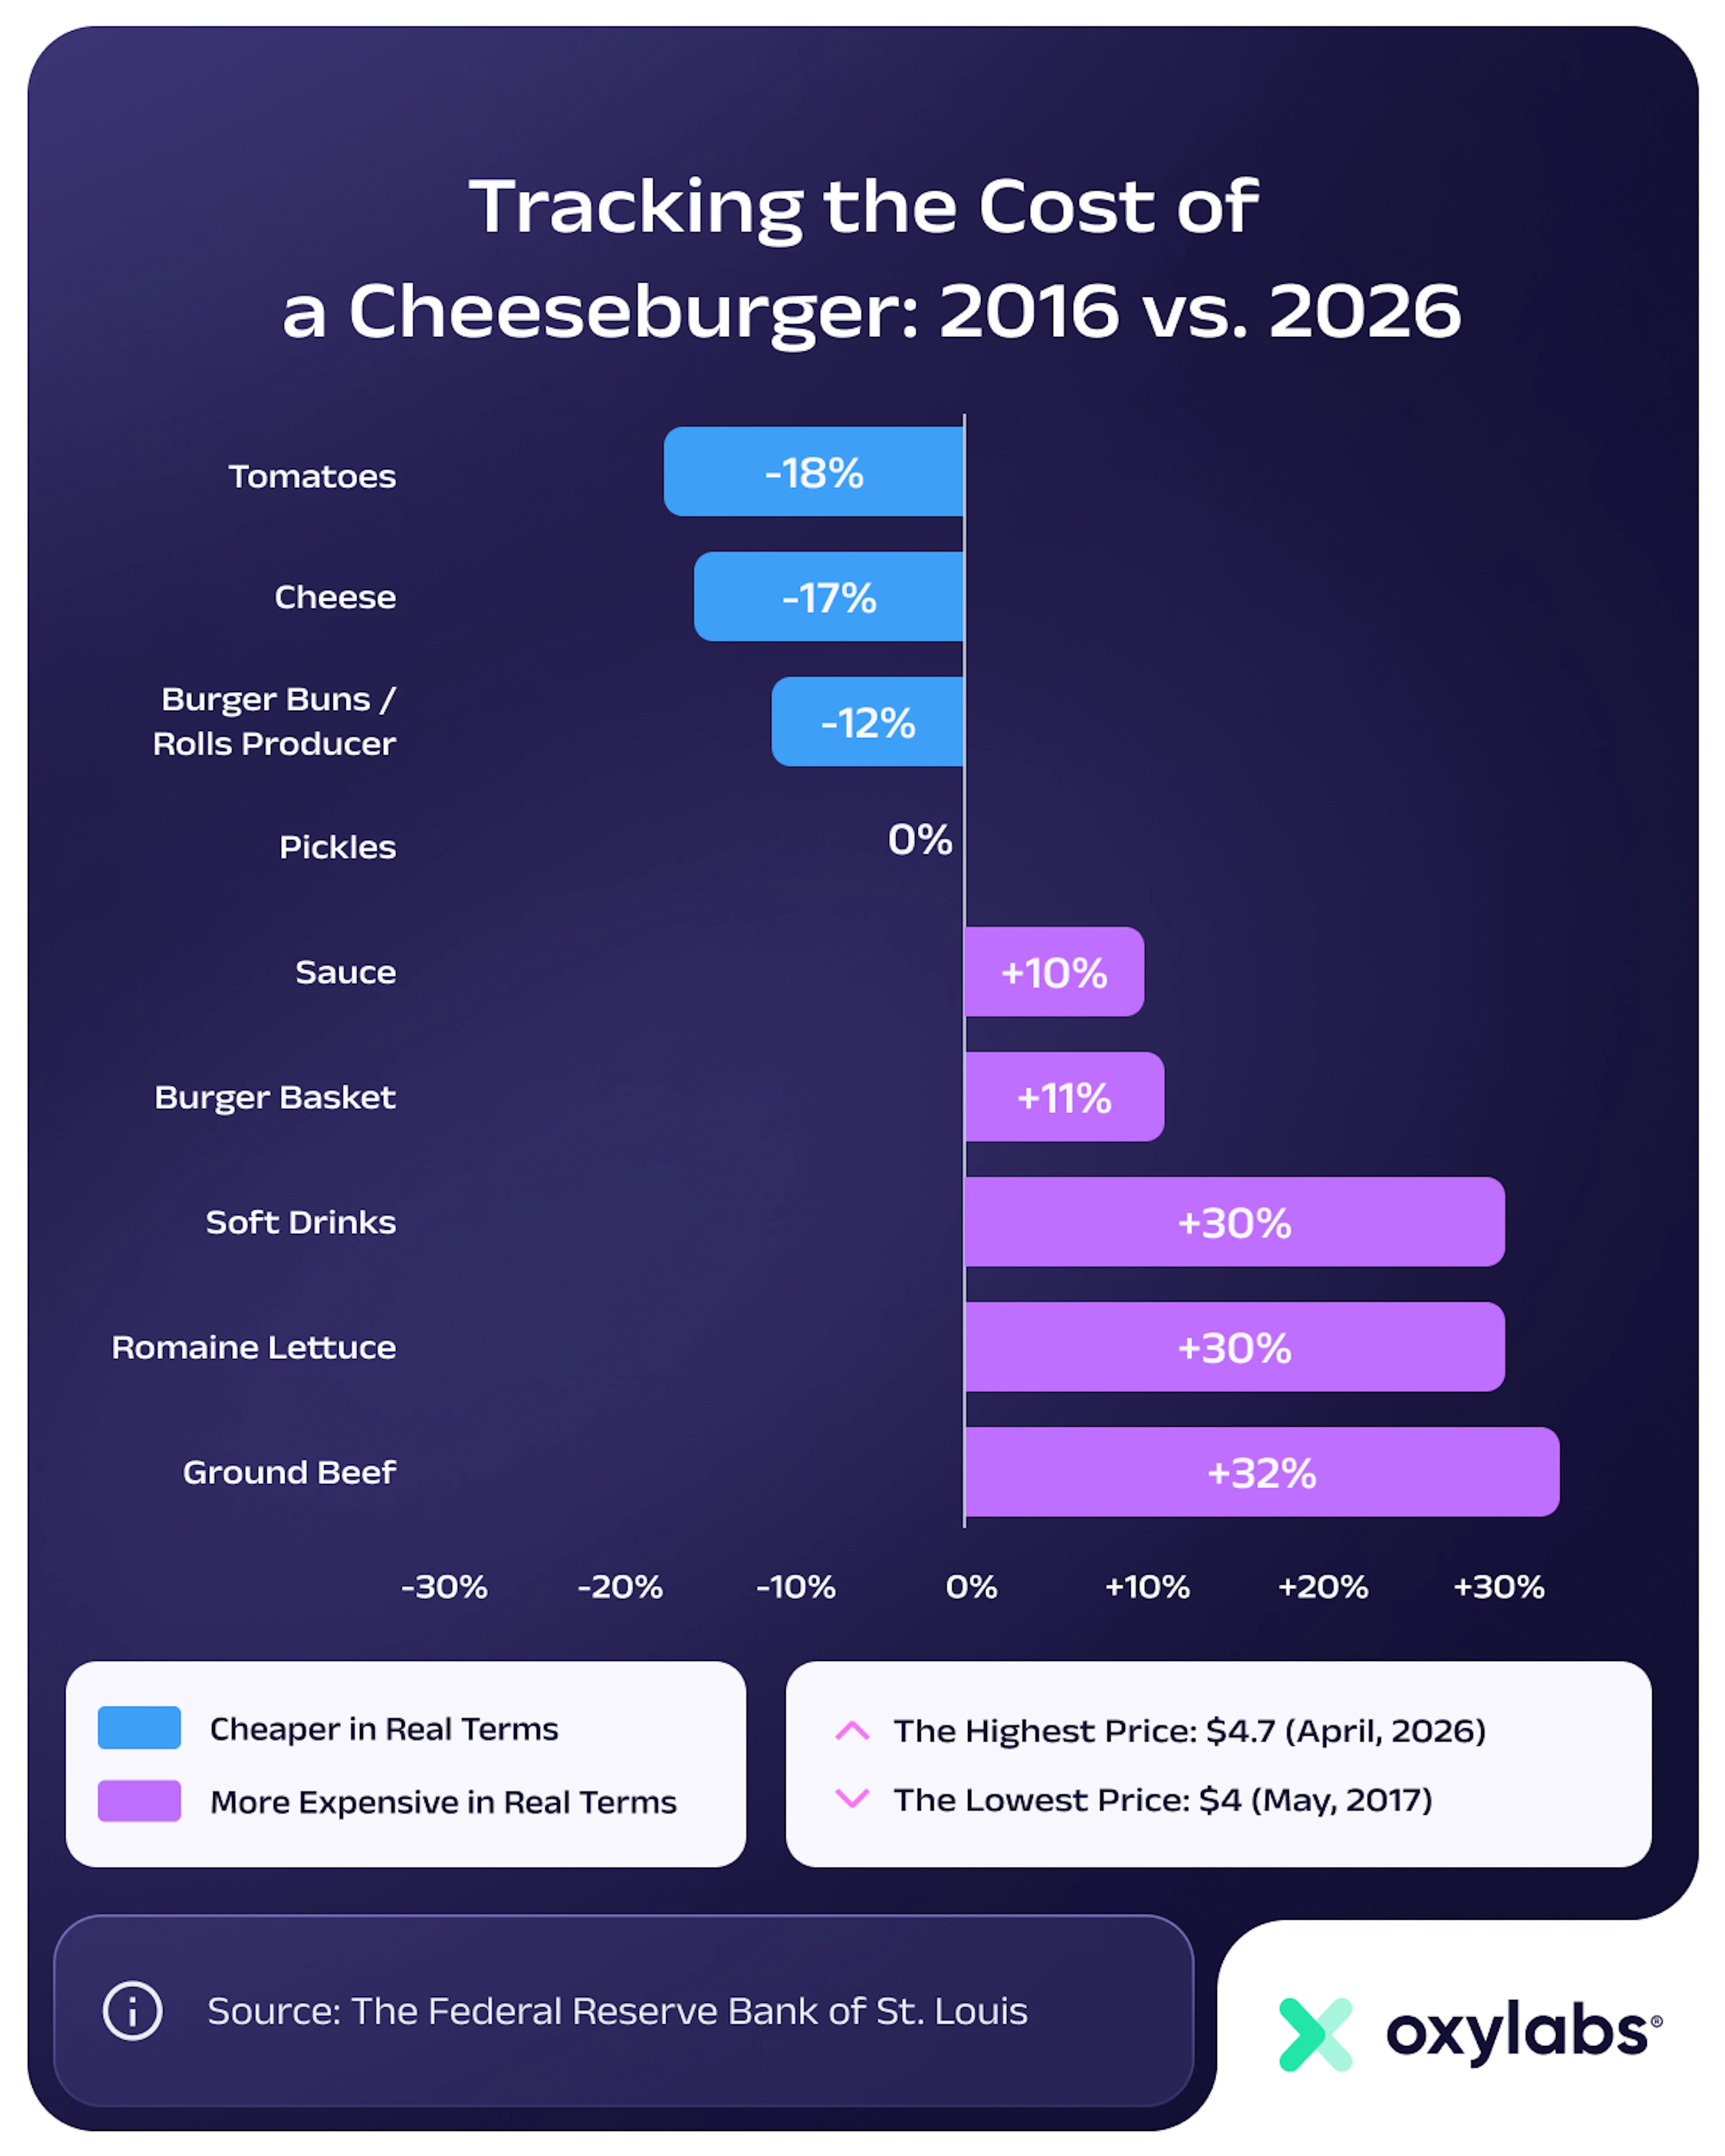
In April 2026, a burger following a standard recipe – ground beef, bun, cheddar cheese, romaine lettuce, tomato, pickles, and sauce – $4.72 in real 2026 dollars, versus $4.47 in January 2016. That 11% increase over ten years is relatively modest. But it conceals enormous movement in opposite directions among the individual ingredients.
The 32% real increase in ground beef’s price was largely offset by cheddar cheese costs, which fell 17% in real terms over the same period, and tomatoes, which have fallen in price by 18%. Both declines reflect genuine structural changes over the decade.
U.S. dairy output expanded significantly, periodically pushing bulk cheese into oversupply and keeping retail prices soft. On the produce side, year-round greenhouse tomato production – with Mexico supplying roughly 70% of U.S. fresh tomatoes by 2024 – drove tomato prices lower faster than overall food inflation through most of the period covered by this analysis.
The burger can be viewed, in effect, as a portfolio, with the cheap ingredients subsidizing the expensive patty.
Beef grabs the headlines, but it’s not the whole story. The diversification of ingredients in a classic burger has acted as a natural hedge – when beef prices spiked, the stability of dairy and produce acted as a stabilizer. You only see that with long-term, basket-level tracking.
Marija Gecaitė, Chief Commercial Officer (CCO) at Oxylabs
The Cookout's Bargain: Hot Dog
The hot dog does not attract the same attention as the beef patty, but in purchasing-power terms, it is the best value it has been for a long time. In real terms, the price of a hot dog – sausage, bun, and ketchup – has essentially stayed the same over the decade, remaining at about $2.06.
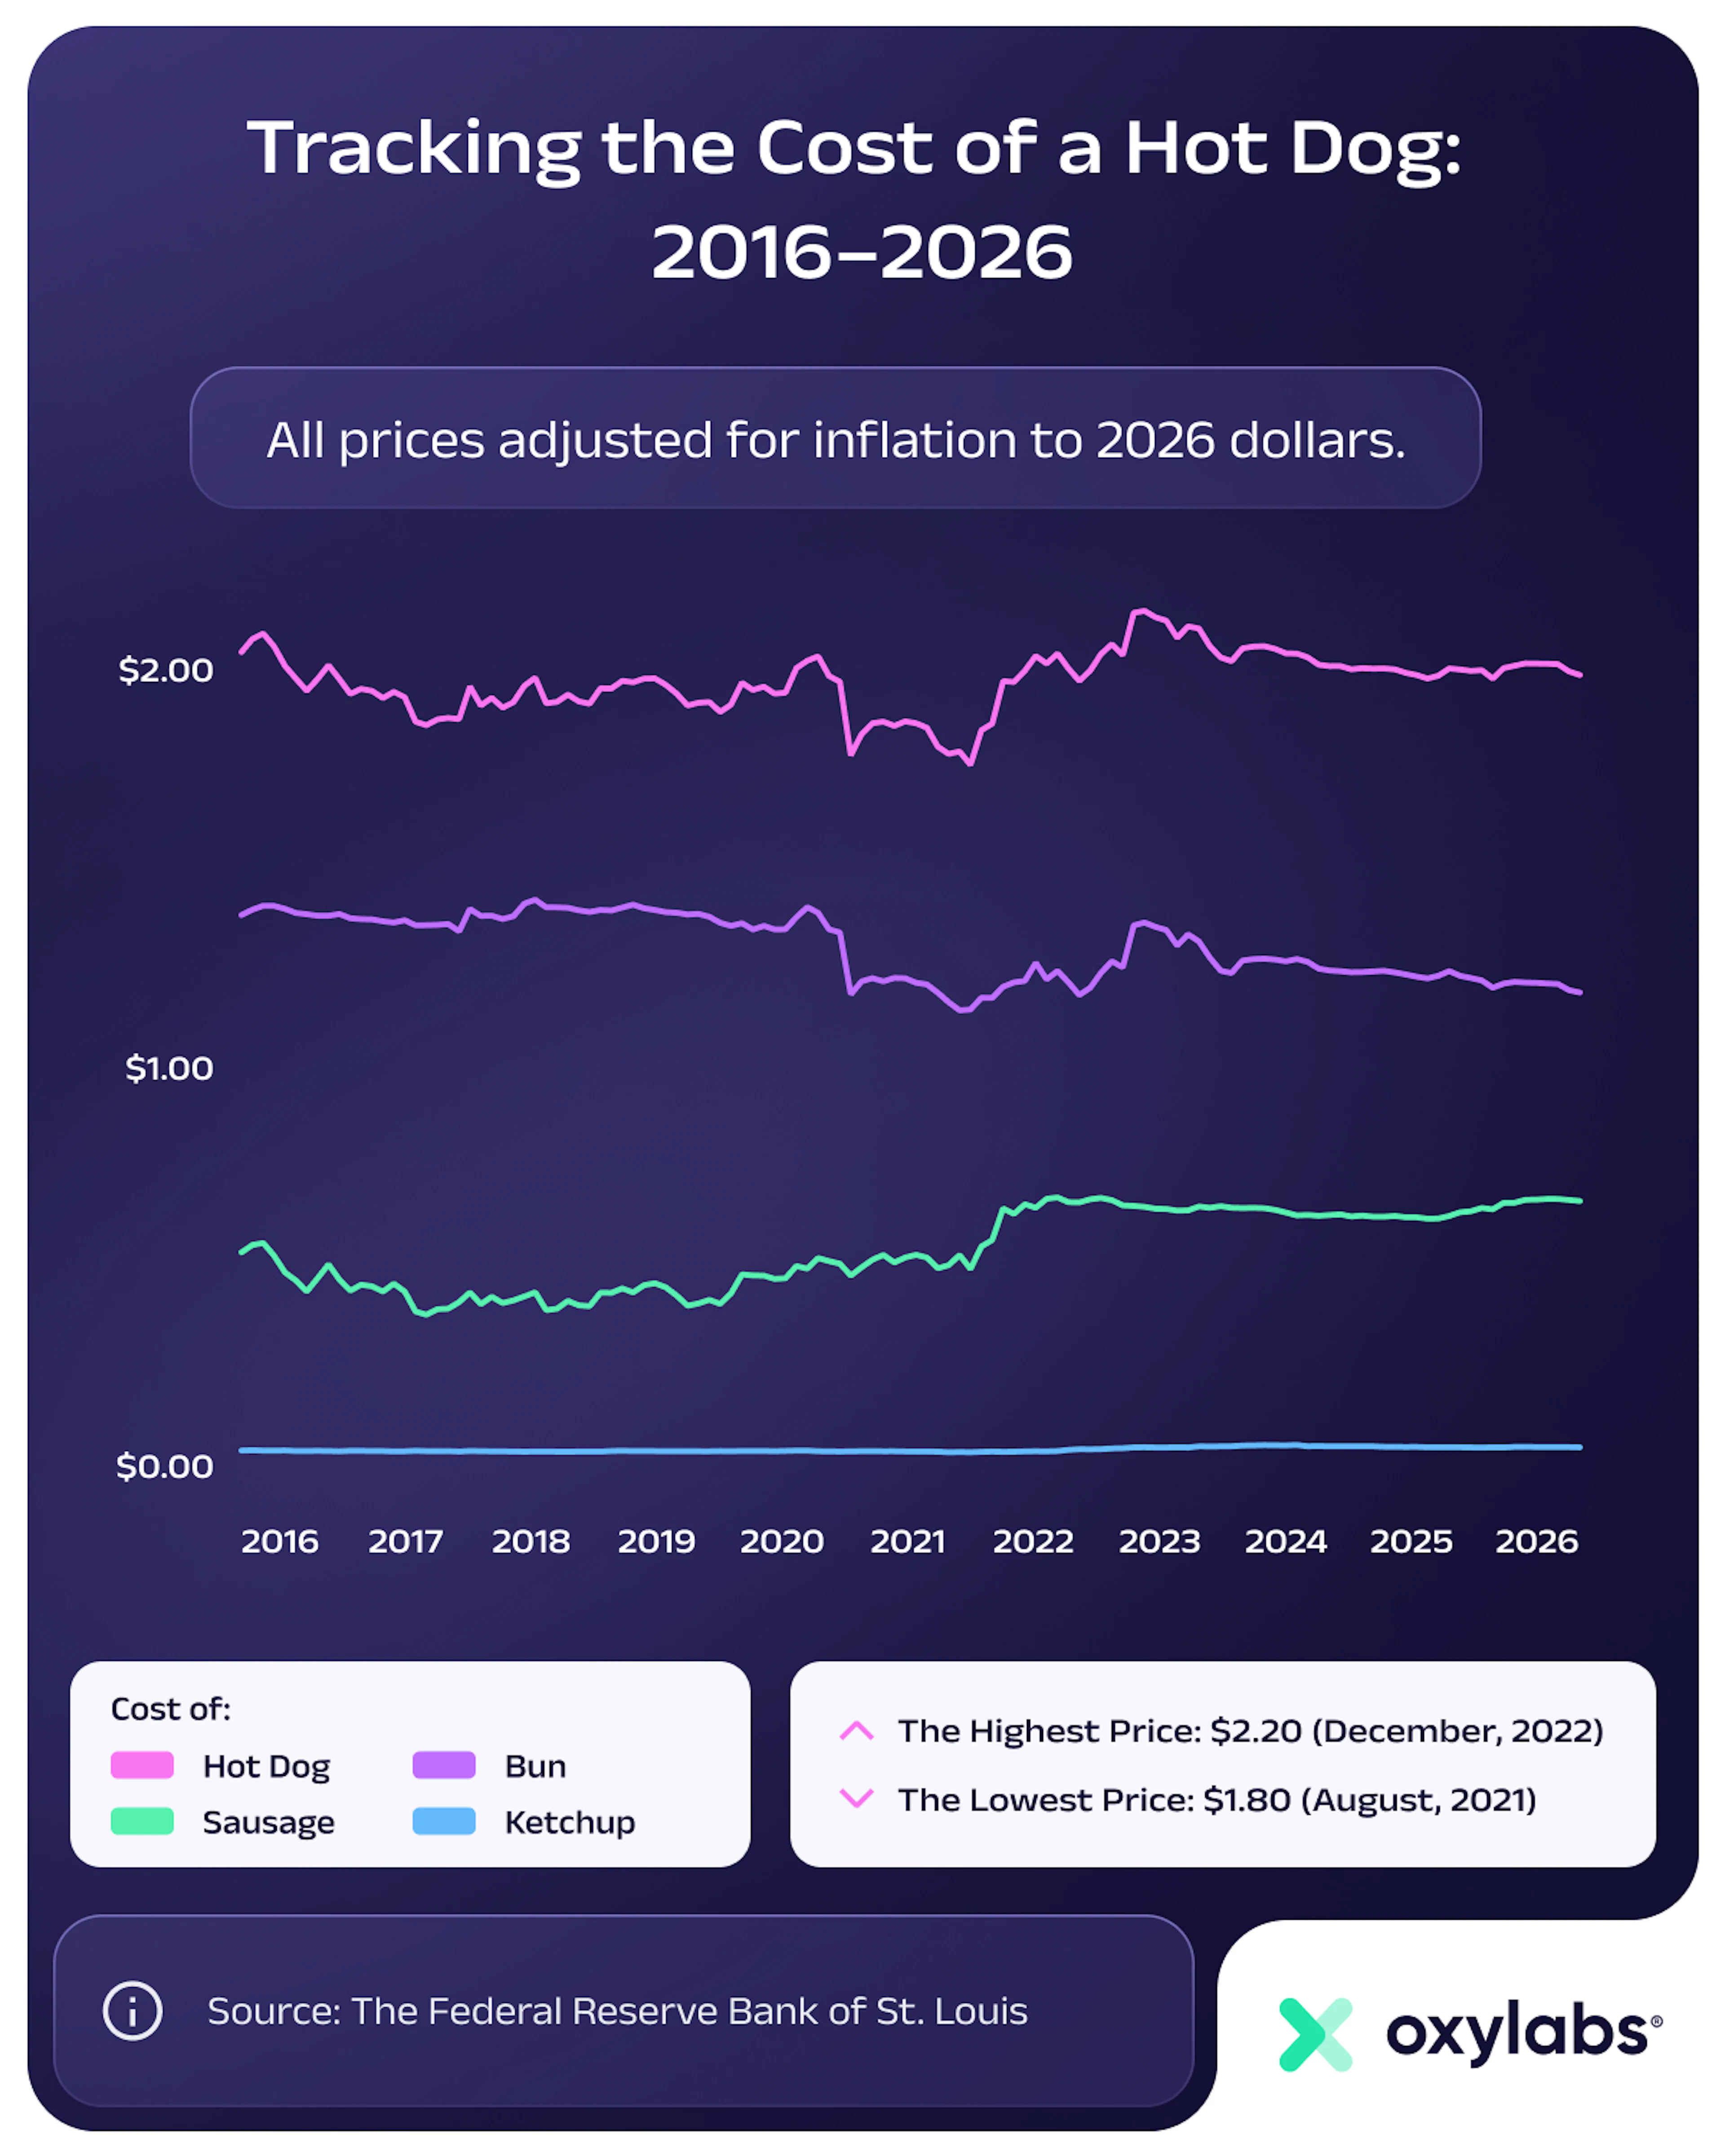
This seems counterintuitive, given that hot dog sausages themselves have risen 33% in real terms since 2016, nearly as much as beef. Pork and beef sausage inputs are driven by the same livestock supply dynamics. At its peak, in April 2022, the real cost of sausage had surged nearly 70% from its 2017 trough, the fastest price jump of any item tracked in the dataset.
The explanation for the hot dog’s overall price drop is in the other ingredients. Buns and ketchup have both gotten cheaper in real terms over the decade. Those savings more than offset the sausage price surge, especially as sausage prices have come down from their 2022 peak.
For July 4th shoppers watching their budgets, this is the practical upshot: the hot dog costs the same in real purchasing-power terms than it was ten years ago, while the burger is slightly more expensive.
Your Two-Liter Has Risen as Much as Your Beef Patty
Unlike meat and produce, soft drink prices took longer to rise over the decade, but also longer to fall. While beef and hot dog prices surged in 2022 then peaked, beverage costs kept climbing steadily for another two years, peaking in early 2024.
The reason is straightforward: aluminum, sugar, and packaging all got more expensive during 2021 through 2023, but drinks companies were slow to pass those costs on to shoppers. This is why the price rise arrived well after the food inflation wave had already crested.
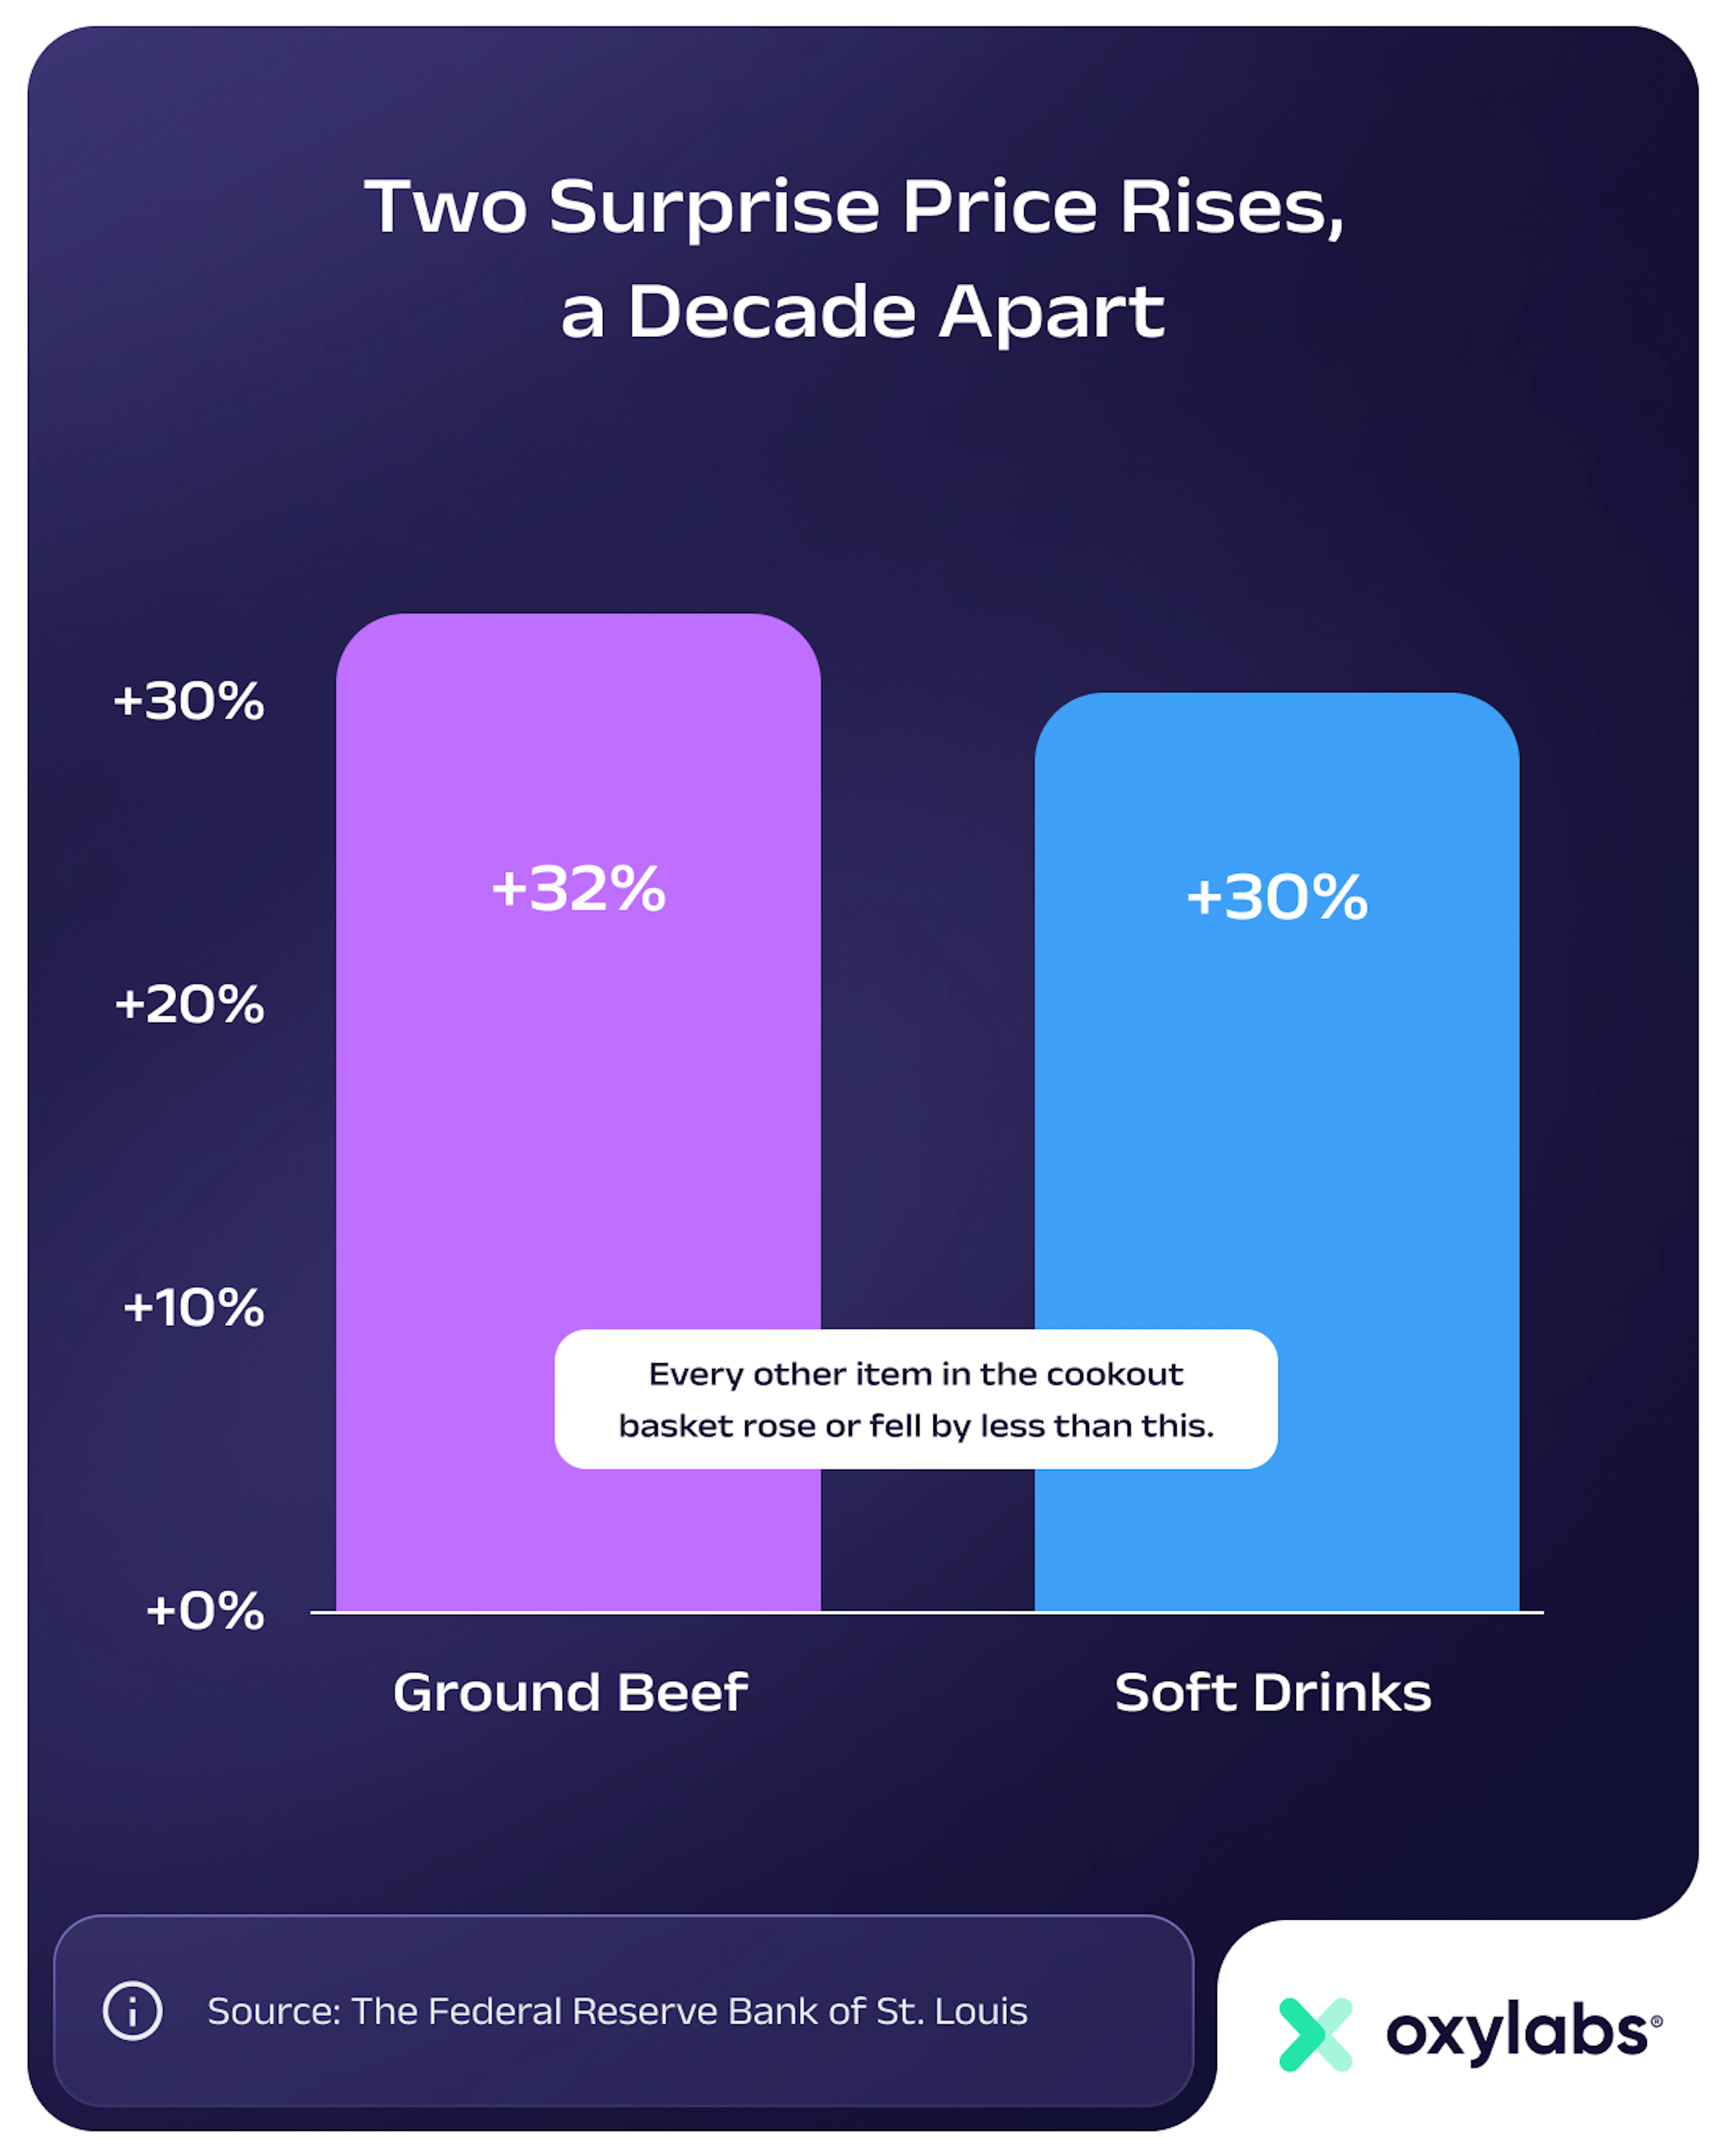
In real terms, a two-liter has risen 30% in cost since 2016, almost exactly the same increase as ground beef. Since the 2024 peak, prices have eased slightly, though they remain well above where they were a decade ago.
For this year’s cookout, that represents modestly good news: of the three items on the table, drinks have come down the most from their recent high. The grill is more expensive than it was in 2019, while the cooler is at least heading in the right direction.
The Paycheck Test: How the Cookout Held Up Over Ten Years
The most useful way to understand cookout affordability is not the dollar price of any single item but the relationship between the whole basket and what a typical American earns.
Oxylabs calculated the share of a median weekly salary that a single-person cookout serving one burger, one hot dog, one soft drink accounts for. They did this for every year from 2016 to 2026, adjusting all figures for inflation so the comparison is in real purchasing power.
The table below shows the cost of a cookout for four people (a typical family) and twelve people (a classic Independence Day gathering) as a percentage of average weekly earnings.
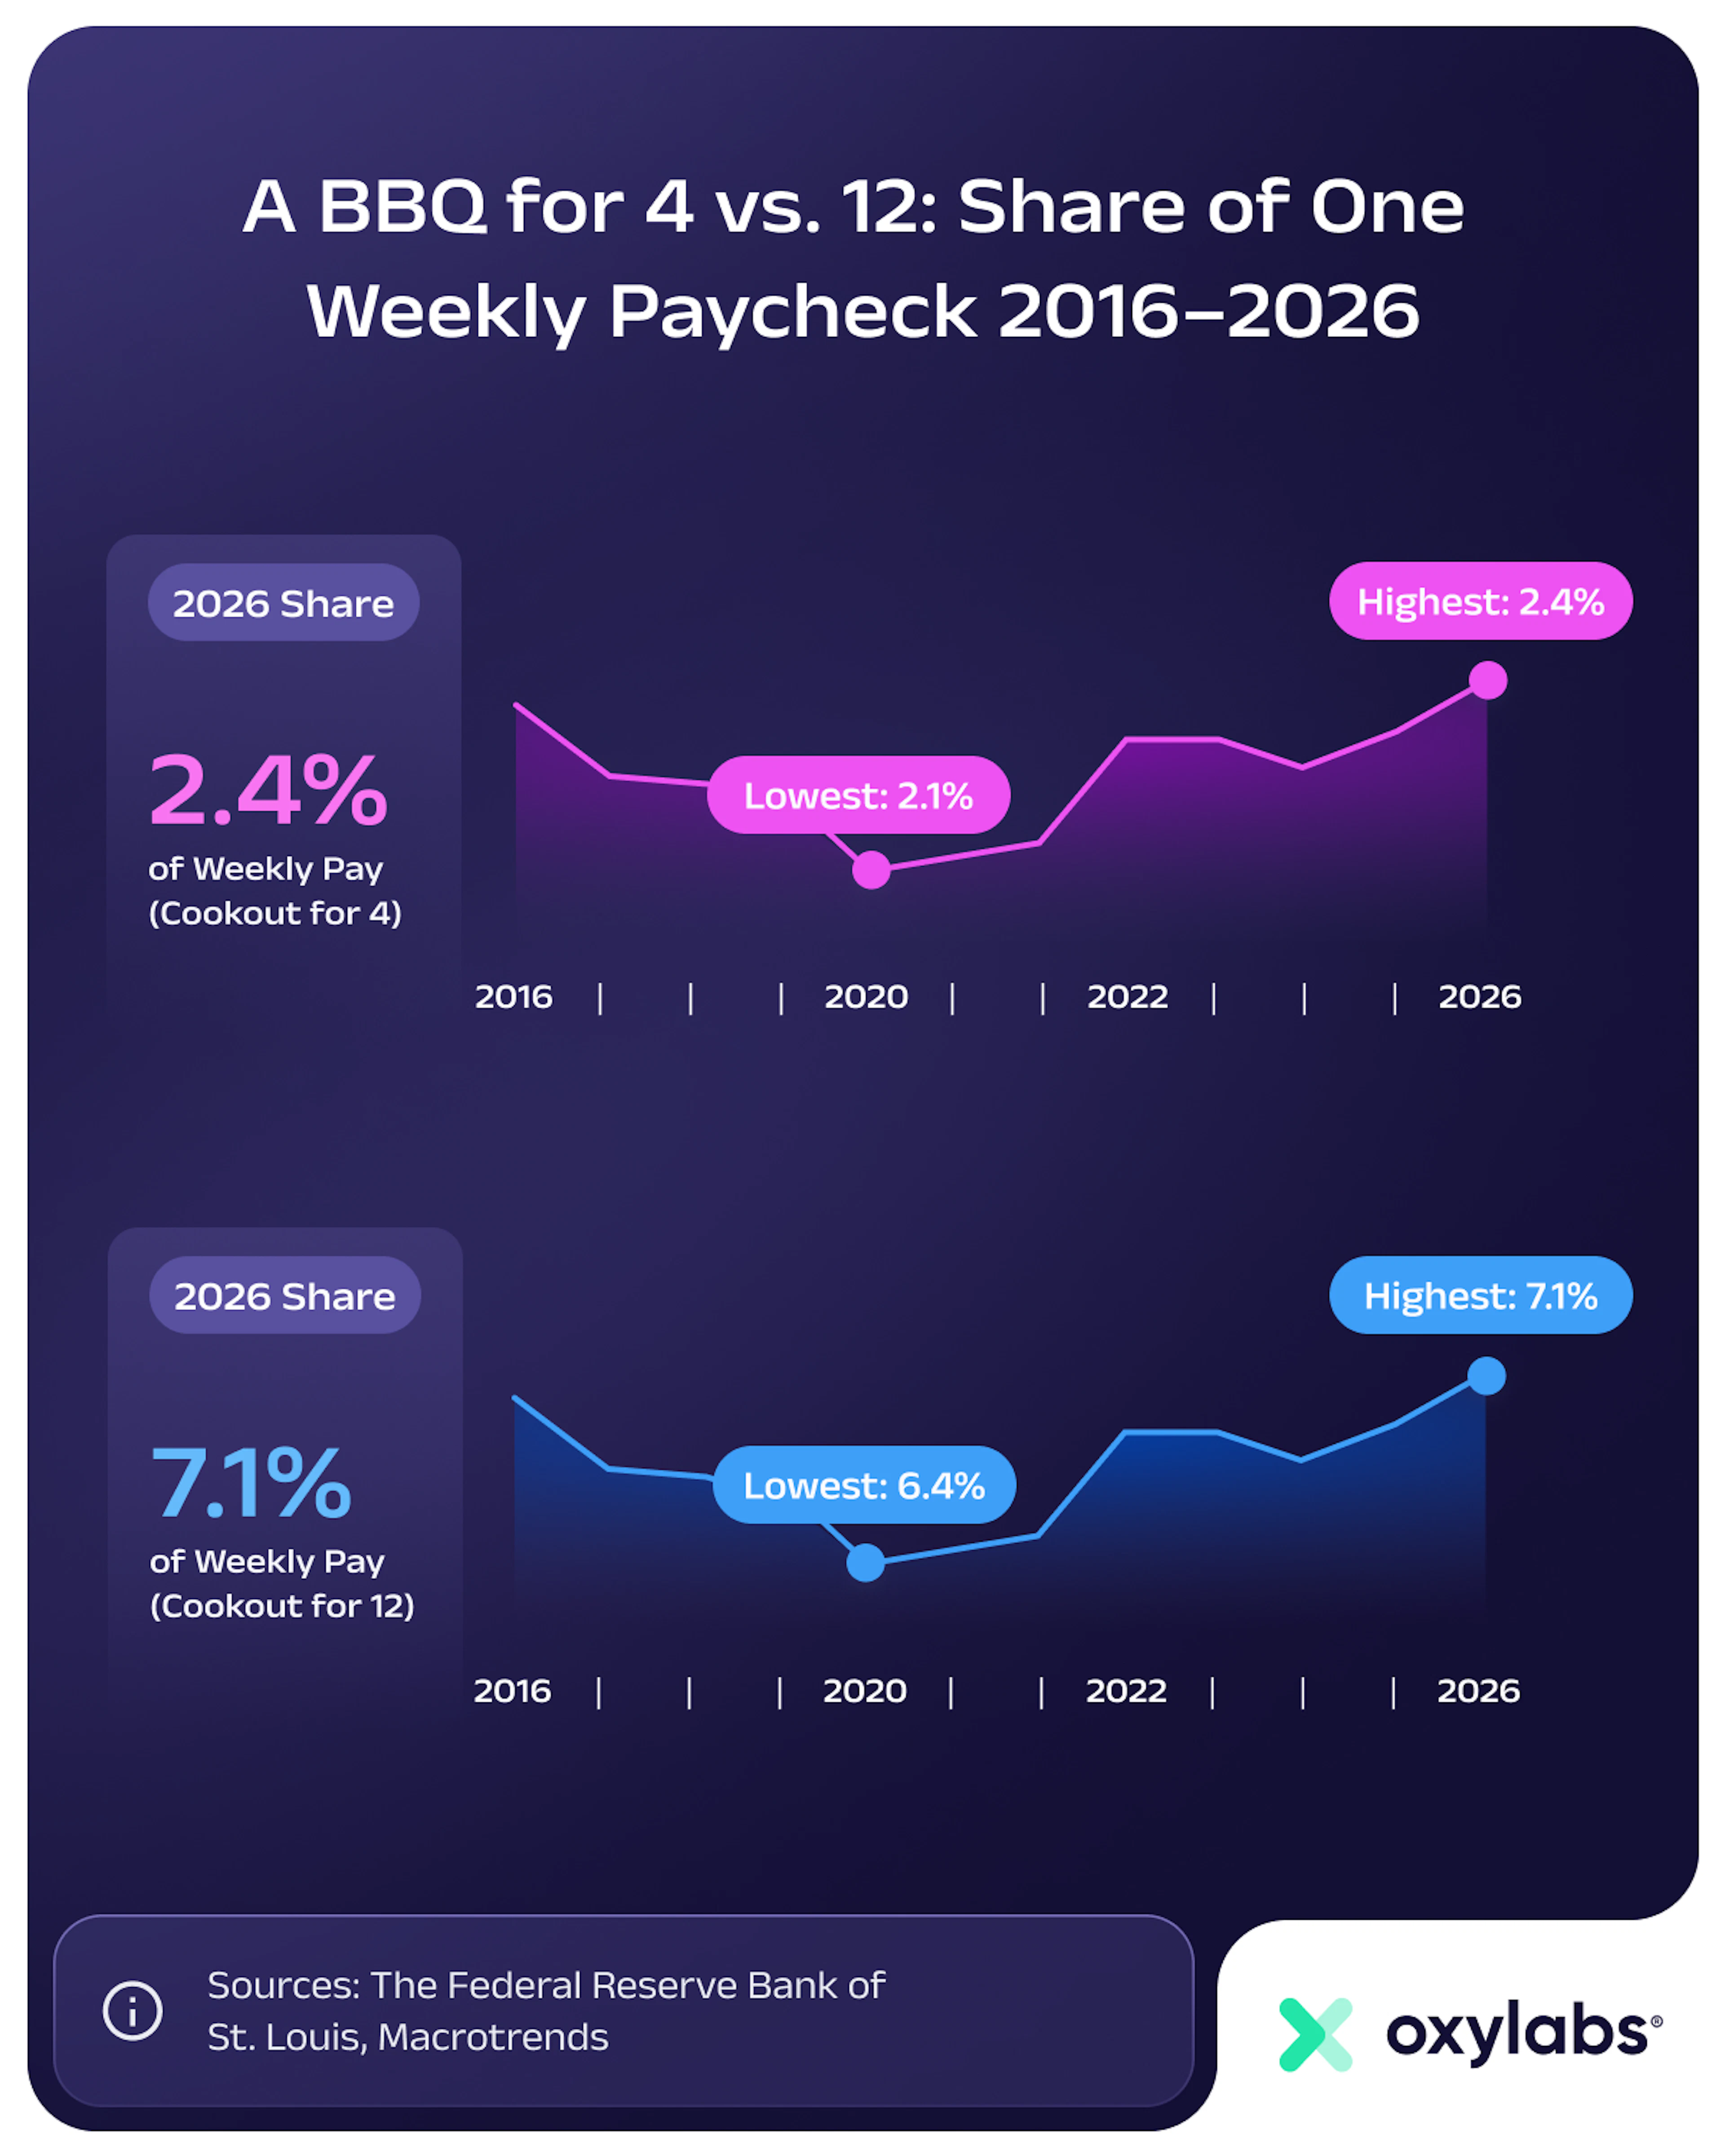
In April 2026, a cookout for four cost about $29 and a cookout for twelve cost about $88. That is equivalent to roughly 2.9 hours of work at the median wage for a dozen guests, or less than half a day’s pay.
The most striking feature of this table is not the 2026 figure itself, but how close it is to the 2016 figure. Ten years of food price volatility, a pandemic, an inflation wave, and a decline in cattle supply have left a typical American worker in almost exactly the same position they were in a decade ago when it comes to funding a July 4th cookout.
It is notable that over this period, real wages grew only 8.6% over the decade, which is less than 1% a year above inflation. When beef prices returned to decade highs, there was no wage growth left to absorb the impact. What little cushion the late 2010s built up has been fully erased.
What the table also shows is that the 2022 inflation wave was the pivotal moment. The jump from 2021 to 2022 was the largest single-year move in the entire dataset, and the years since have brought only partial relief. In affordability terms, 2026 is the second-worst year of the past decade.
The affordability debate is too binary. The cookout hasn’t become unaffordable, but the margin for change is gone. Americans enjoyed a unique buffer period in 2019 and 2020 that made costs feel predictable, but that cushion has been fully eroded. Consumers aren’t necessarily priced out, but they are now significantly more vulnerable to the next market shock.
Marija Gecaitė, Chief Commercial Officer (CCO) at Oxylabs
What This Means for Cookout Shoppers
The data produces a few practical conclusions for anyone planning a July 4th cookout this year:
Beef is the biggest driver of cost. Shoppers who are willing to be flexible, whether it is choosing different cuts or alternative pack sizes, can find lower price points. However, the broader trend remains upward. Prices are not expected to ease until the cattle herd has had more time to rebuild.
Hot dogs are underrated as a budget option. In real purchasing-power terms, hot dogs cost less than they did a decade ago. The 2022 price spike has largely retraced, and the savings available are real. For a large cookout, mixing hot dogs and burgers is measurably cheaper than an all-burger spread.
Cheese and tomatoes are genuine bargains relative to their historical prices. A decade of dairy oversupply and greenhouse tomato expansion has made both significantly cheaper in real terms. Lean into them on the burger.
Soft drinks are off their 2024 peak but prices are still elevated relative to 2016. Store-brand sodas and sparkling waters are significantly cheaper than their branded equivalents, and the price difference keeps growing.
The NRF reports that the average July 4th celebrator plans to spend $92.44 on food items this year, and over two-thirds say they have noticed higher prices. The data suggests that this perception is partially accurate (beef and beverages are up significantly in real terms).
However, it is also partially a function of inflation psychology, with the overall basket having barely moved in real purchasing-power terms since 2016.
About the Expert
Marija Gecaite is Chief Commercial Officer at Oxylabs. A commercial strategy expert with a decade of experience across wealth management and cybersecurity, she previously led international sales organizations and now focuses on driving long-term global growth.
Methodology
Sample
The burger recipe was sourced from The New York Times, and includes ground beef, burger buns/rolls, cheddar cheese, romaine lettuce, tomatoes, pickles, and sauce.
The hot dog recipe was also sourced from the New York Times, and includes a sausage, a bun, and ketchup.
Data Sources
Analysis
Key Terms
Limitations
Frequently asked questions
Has the July 4th BBQ become more expensive?
In nominal terms, yes – sticker prices are higher than they were in 2016. In real, inflation-adjusted terms, the answer is more nuanced. The overall cookout basket (one burger, one hot dog, one soft drink) costs about 4% more in real dollars than it did a decade ago, but as a share of a median weekly paycheck, 2026 is nearly identical to 2016: roughly 0.6% of weekly earnings for one person, or about 2.4% for a cookout of four.
Which BBQ ingredient has increased the most?
Which BBQ ingredients have gotten cheaper?
Are hot dogs cheaper or more expensive than burgers?
When was the cookout least affordable over the last ten years?
Forget about complex web scraping processes
Choose Oxylabs' advanced web intelligence collection solutions to gather real-time public data hassle-free.
About the author
Oxylabs Research
Data-driven Storytellers
Oxylabs Research is the research and storytelling team at Oxylabs. We use ethical, compliant Oxylabs scraping tools to collect only publicly available web data – never private, paywalled, or personal data – and turn it into clear, timely insights that help everyone make sense of a fast‑changing technological, economic, and social reality. Our work is designed to support original reporting and analysis by journalists and to serve the broader public good. If you’re working on a story or investigation and need reliable web data to back it up, get in touch at press@oxylabs.io.
All information on Oxylabs Blog is provided on an "as is" basis and for informational purposes only. We make no representation and disclaim all liability with respect to your use of any information contained on Oxylabs Blog or any third-party websites that may be linked therein. Before engaging in scraping activities of any kind you should consult your legal advisors and carefully read the particular website's terms of service or receive a scraping license.
Scale up your business with Oxylabs®
Proxies
Advanced proxy solutions
Data Collection
Datasets
Resources
Innovation hub